macOSMac utilities for power users.
iOSiPhone apps for the field.
XRSpatial computing experiences.
WorkflowsPre-built pipeline templates.
Gauge
Menu-bar system monitor
↓ 771 Downloads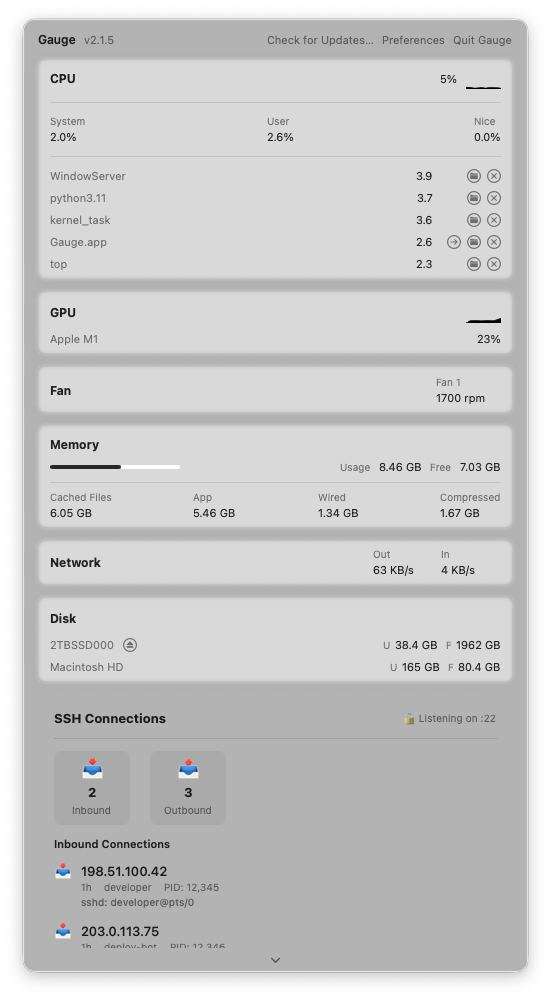

Gauge sits quietly in your menu bar and shows you exactly what your Mac is doing. Real-time CPU per-core usage, memory pressure, network throughput, GPU utilization, and disk I/O — all in a compact popover. Click to expand into detailed graphs. Set custom thresholds and get notified when something needs attention. Zero configuration required — it just works.
Version2.1.58
Size12.4 MB
CategoryUtilities
DeveloperSecondSee
CompatibilitymacOS 14+, Apple Silicon, Intel
What's New
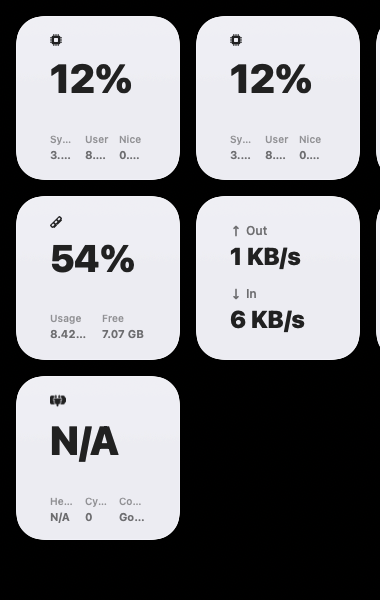
Version 2.1.5 fixes widget data sharing via App Group containers, adds desktop widgets (CPU, GPU, Memory, Network, Battery) with real-time metrics, and resolves Sparkle update detection. SSH connection monitoring is now enabled by default with RFC 5737 documentation addresses for CI screenshots.
Version History3 versions›
Version 2.1.5July 2026↓ 18 Downloads
- Fixed widget data sharing — App Group containers now use Team ID prefix for TCC-protected access
- Added desktop widgets: CPU, GPU, Memory, Network, Battery
- Resolved Sparkle update detection (build number now uses git rev-list --count with full history)
- SSH connection monitoring enabled by default with RFC 5737 mock IPs for CI mode
- Container migration preserves existing user settings on upgrade
Version 2.1.4June 2026↓ 13 Downloads
- SSH connection monitoring (active sessions, inbound/outbound tracking)
- Apple M4 GPU monitoring support
- Redesigned popover with sparkline graphs
- Configurable alert thresholds
Version 2.1.3May 2026↓ 13 Downloads
- Initial Sparkle auto-update support
- Network throughput per-interface breakdown
- Disk I/O monitoring with per-volume stats